CLIMATE · SOUTH AMERICA · EL NIÑO 2026
Super El Niño 2026: the Pacific warms up like in 1997 and South America counts down
NASA satellites, NOAA and WMO forecasts agree: the current event resembles the historic one of 1997-98 and could surpass it. Peru and Ecuador are already feeling the heat of the sea; Chile and Argentina are preparing for a spring and summer with more rain than normal.
✍️ By Redacción · 📅 Saturday, October 24, 2026 · 🔄 Updated 24/10/2026, 20:40 (ART) · 🕒 Reading time: 13 min
📑 In this article
• 🛰️ What the Satellites See: The 1997 Mirror
• 🌡️ The official numbers
• 🔎 Stronger than 1997? What can be said and what cannot be said
• 🌎 Expected impacts, country by country
• 💰 The precedent: what it cost 1997-98
• 🧭 What to watch in the coming weeks
• ❓ Frequently asked questions about El Niño 2026
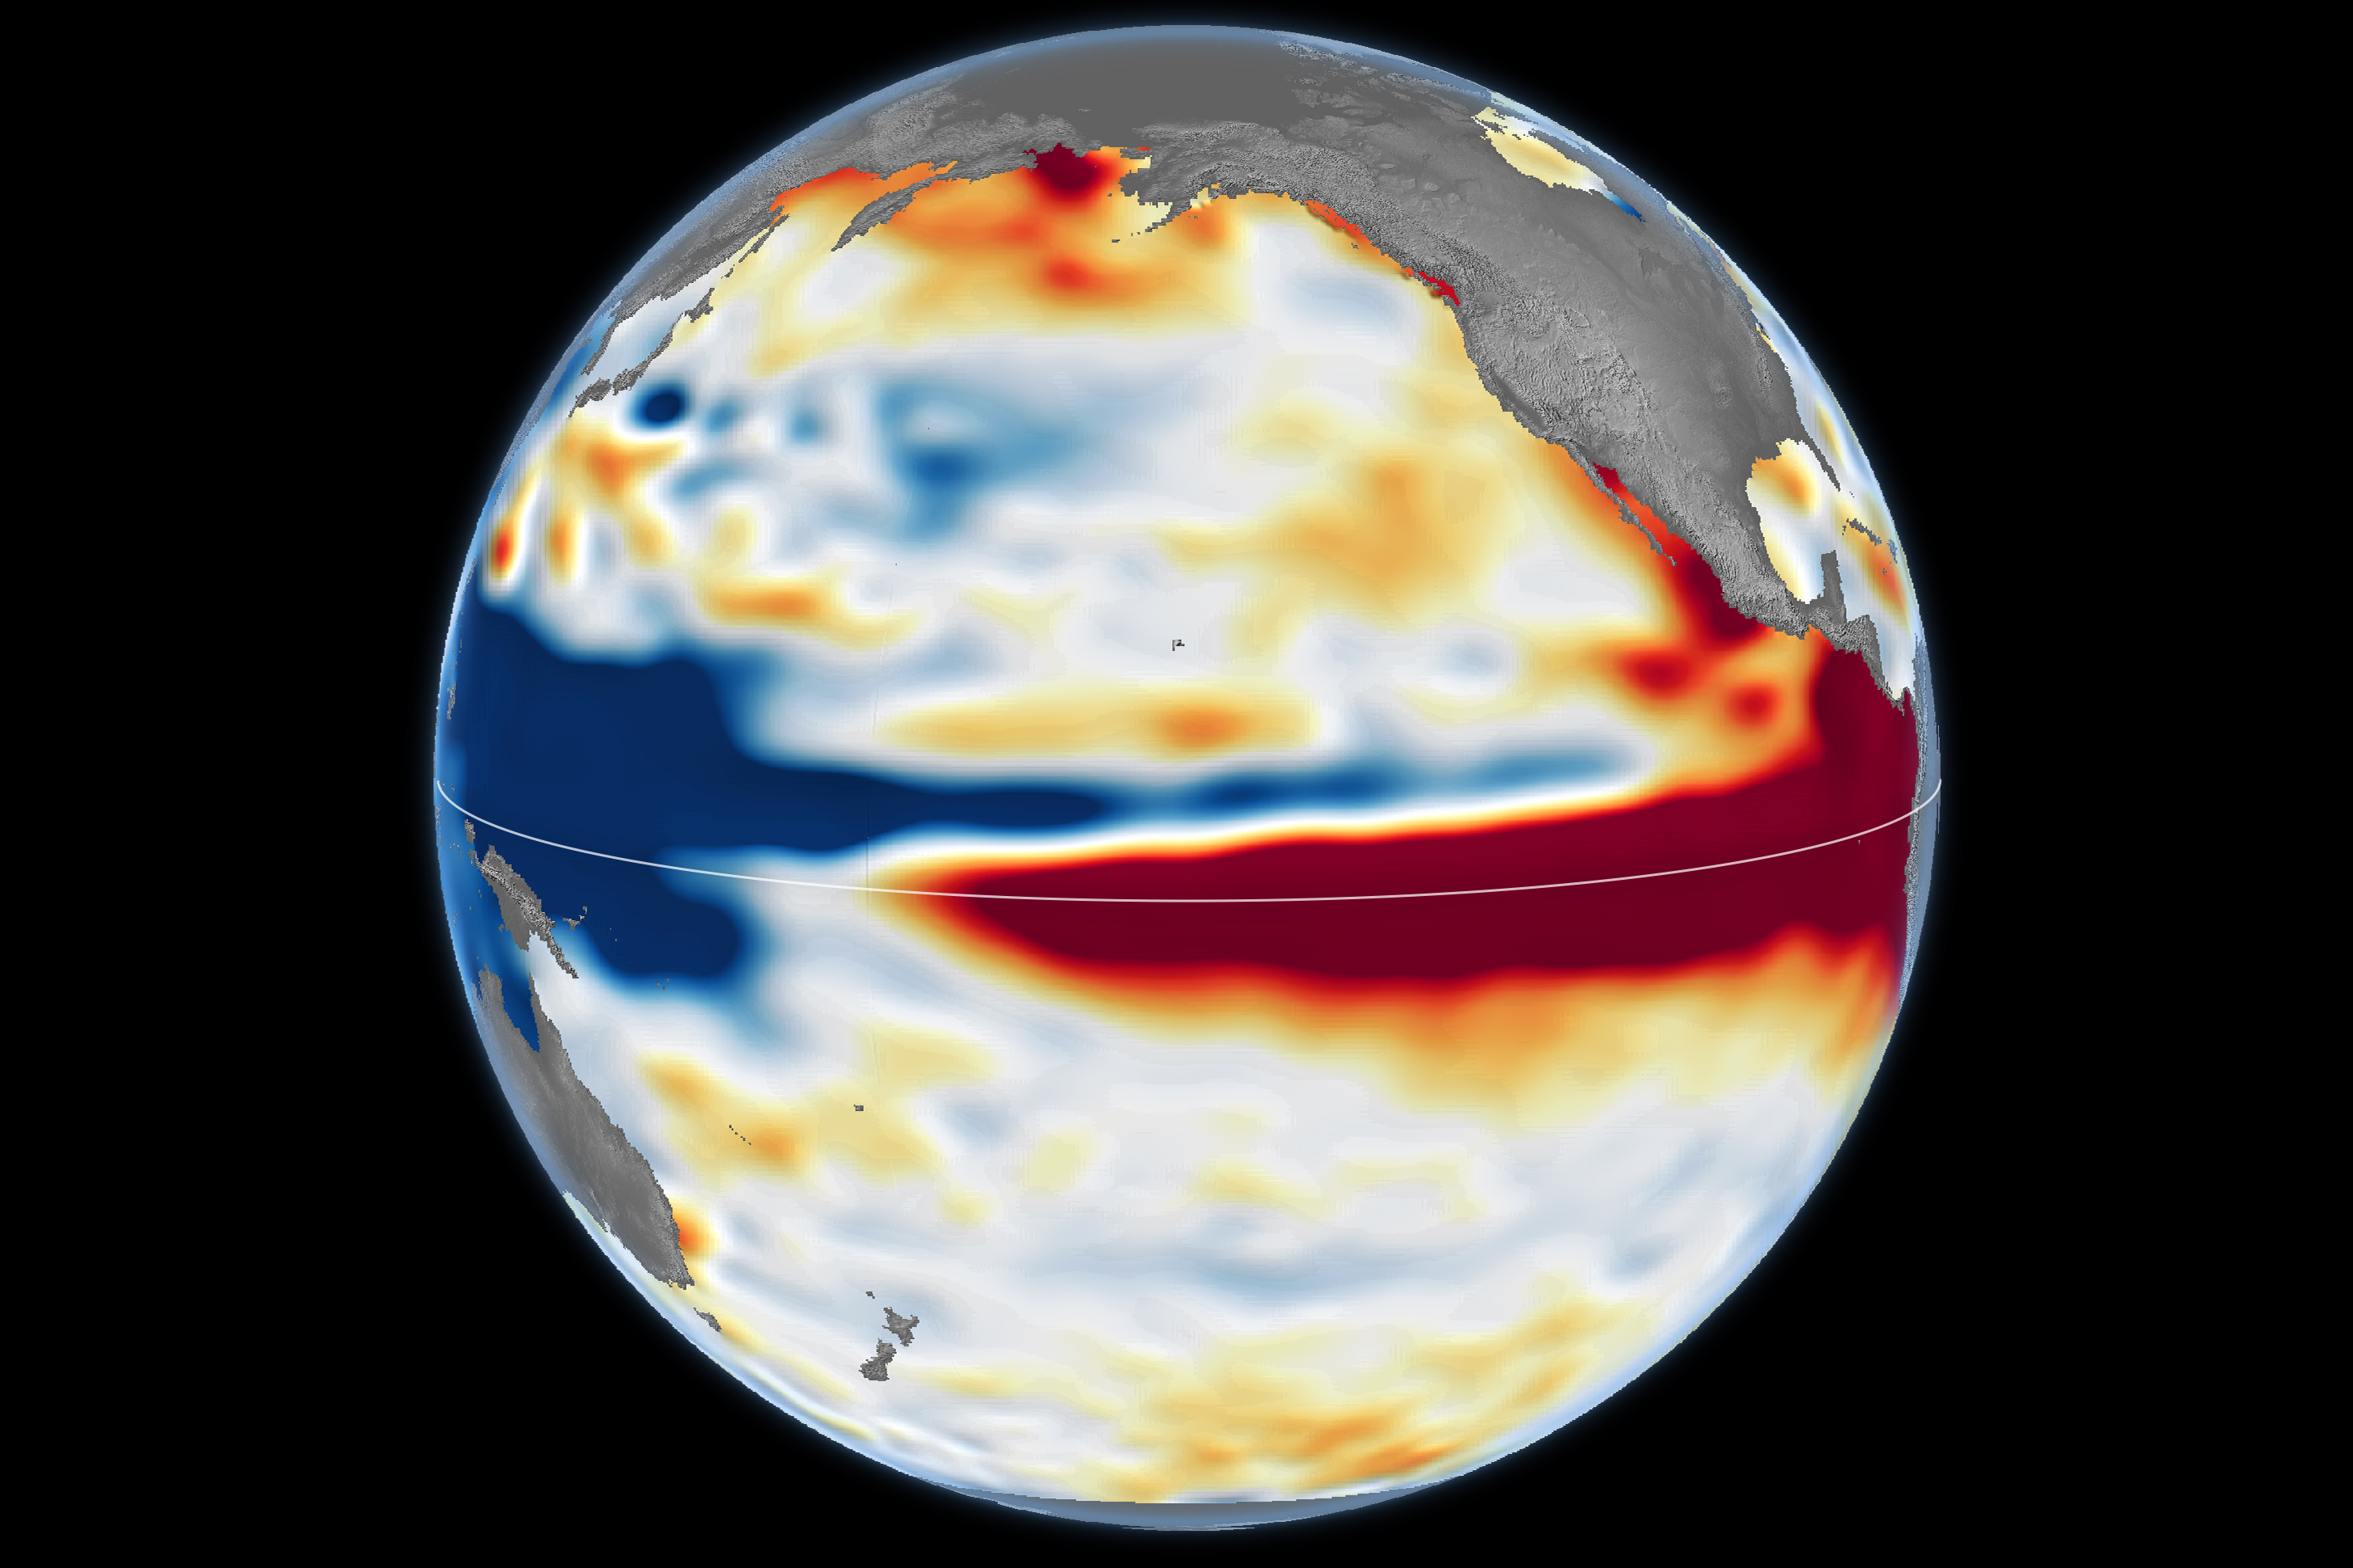
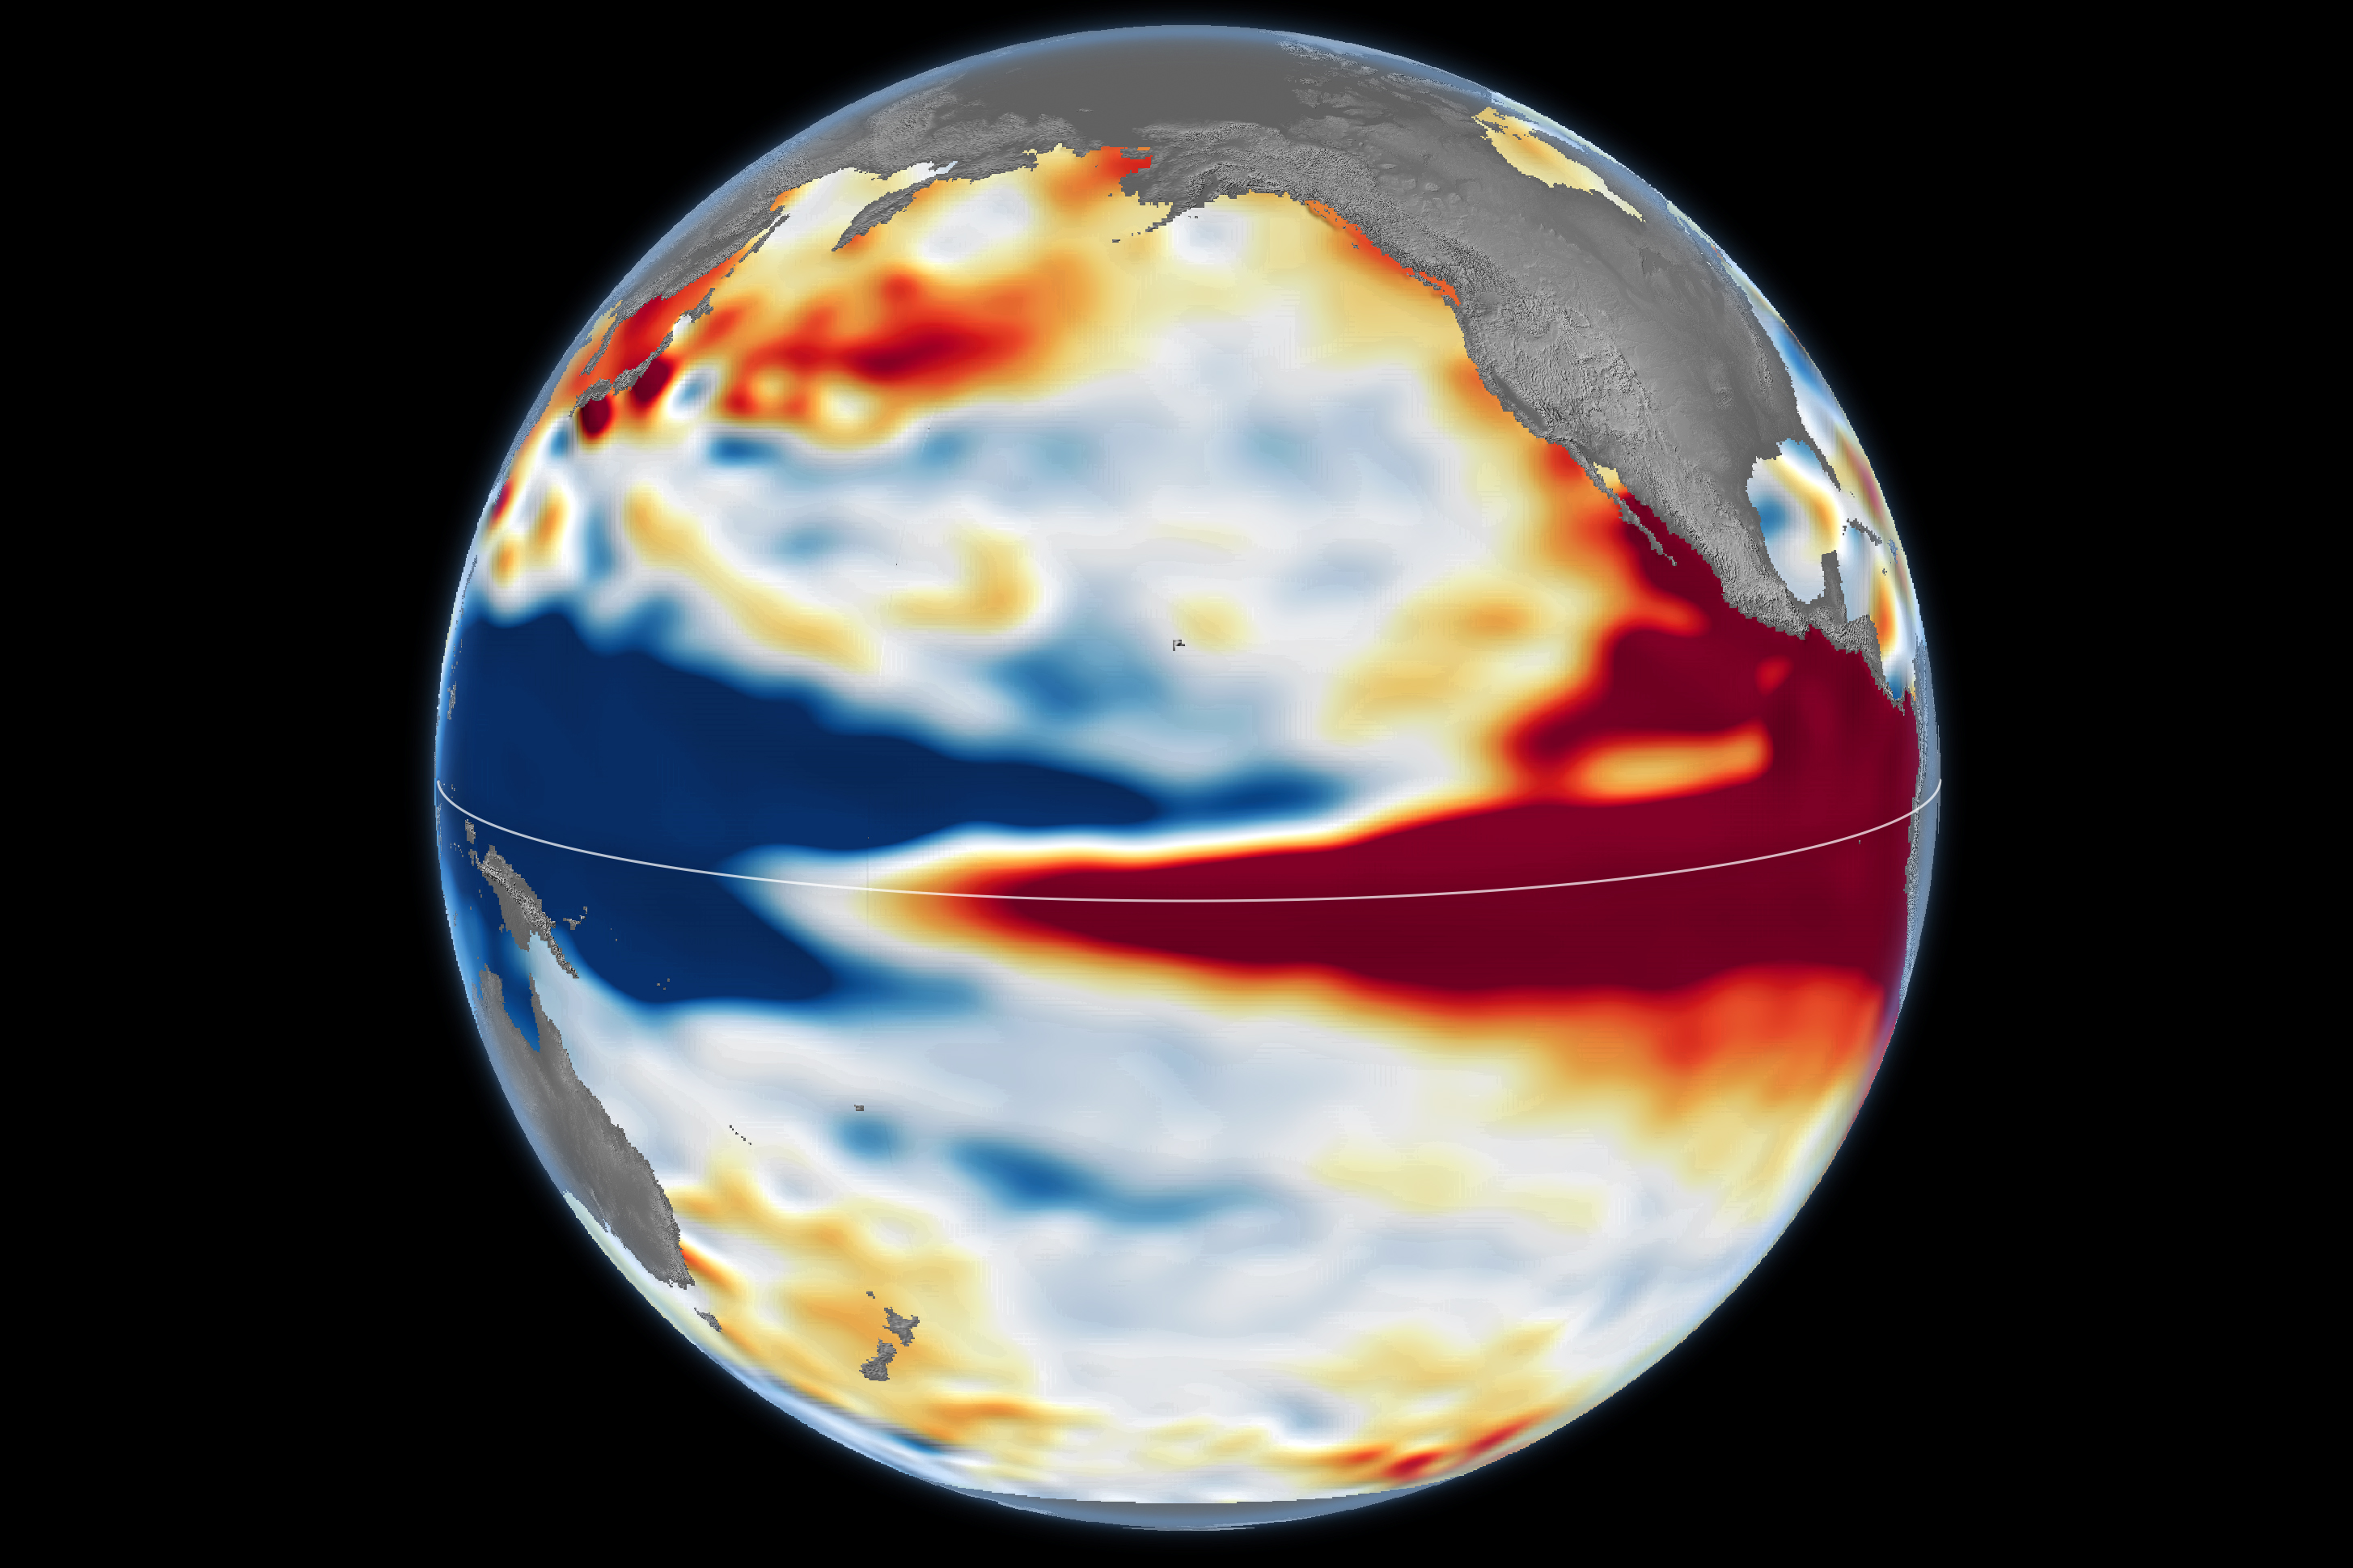
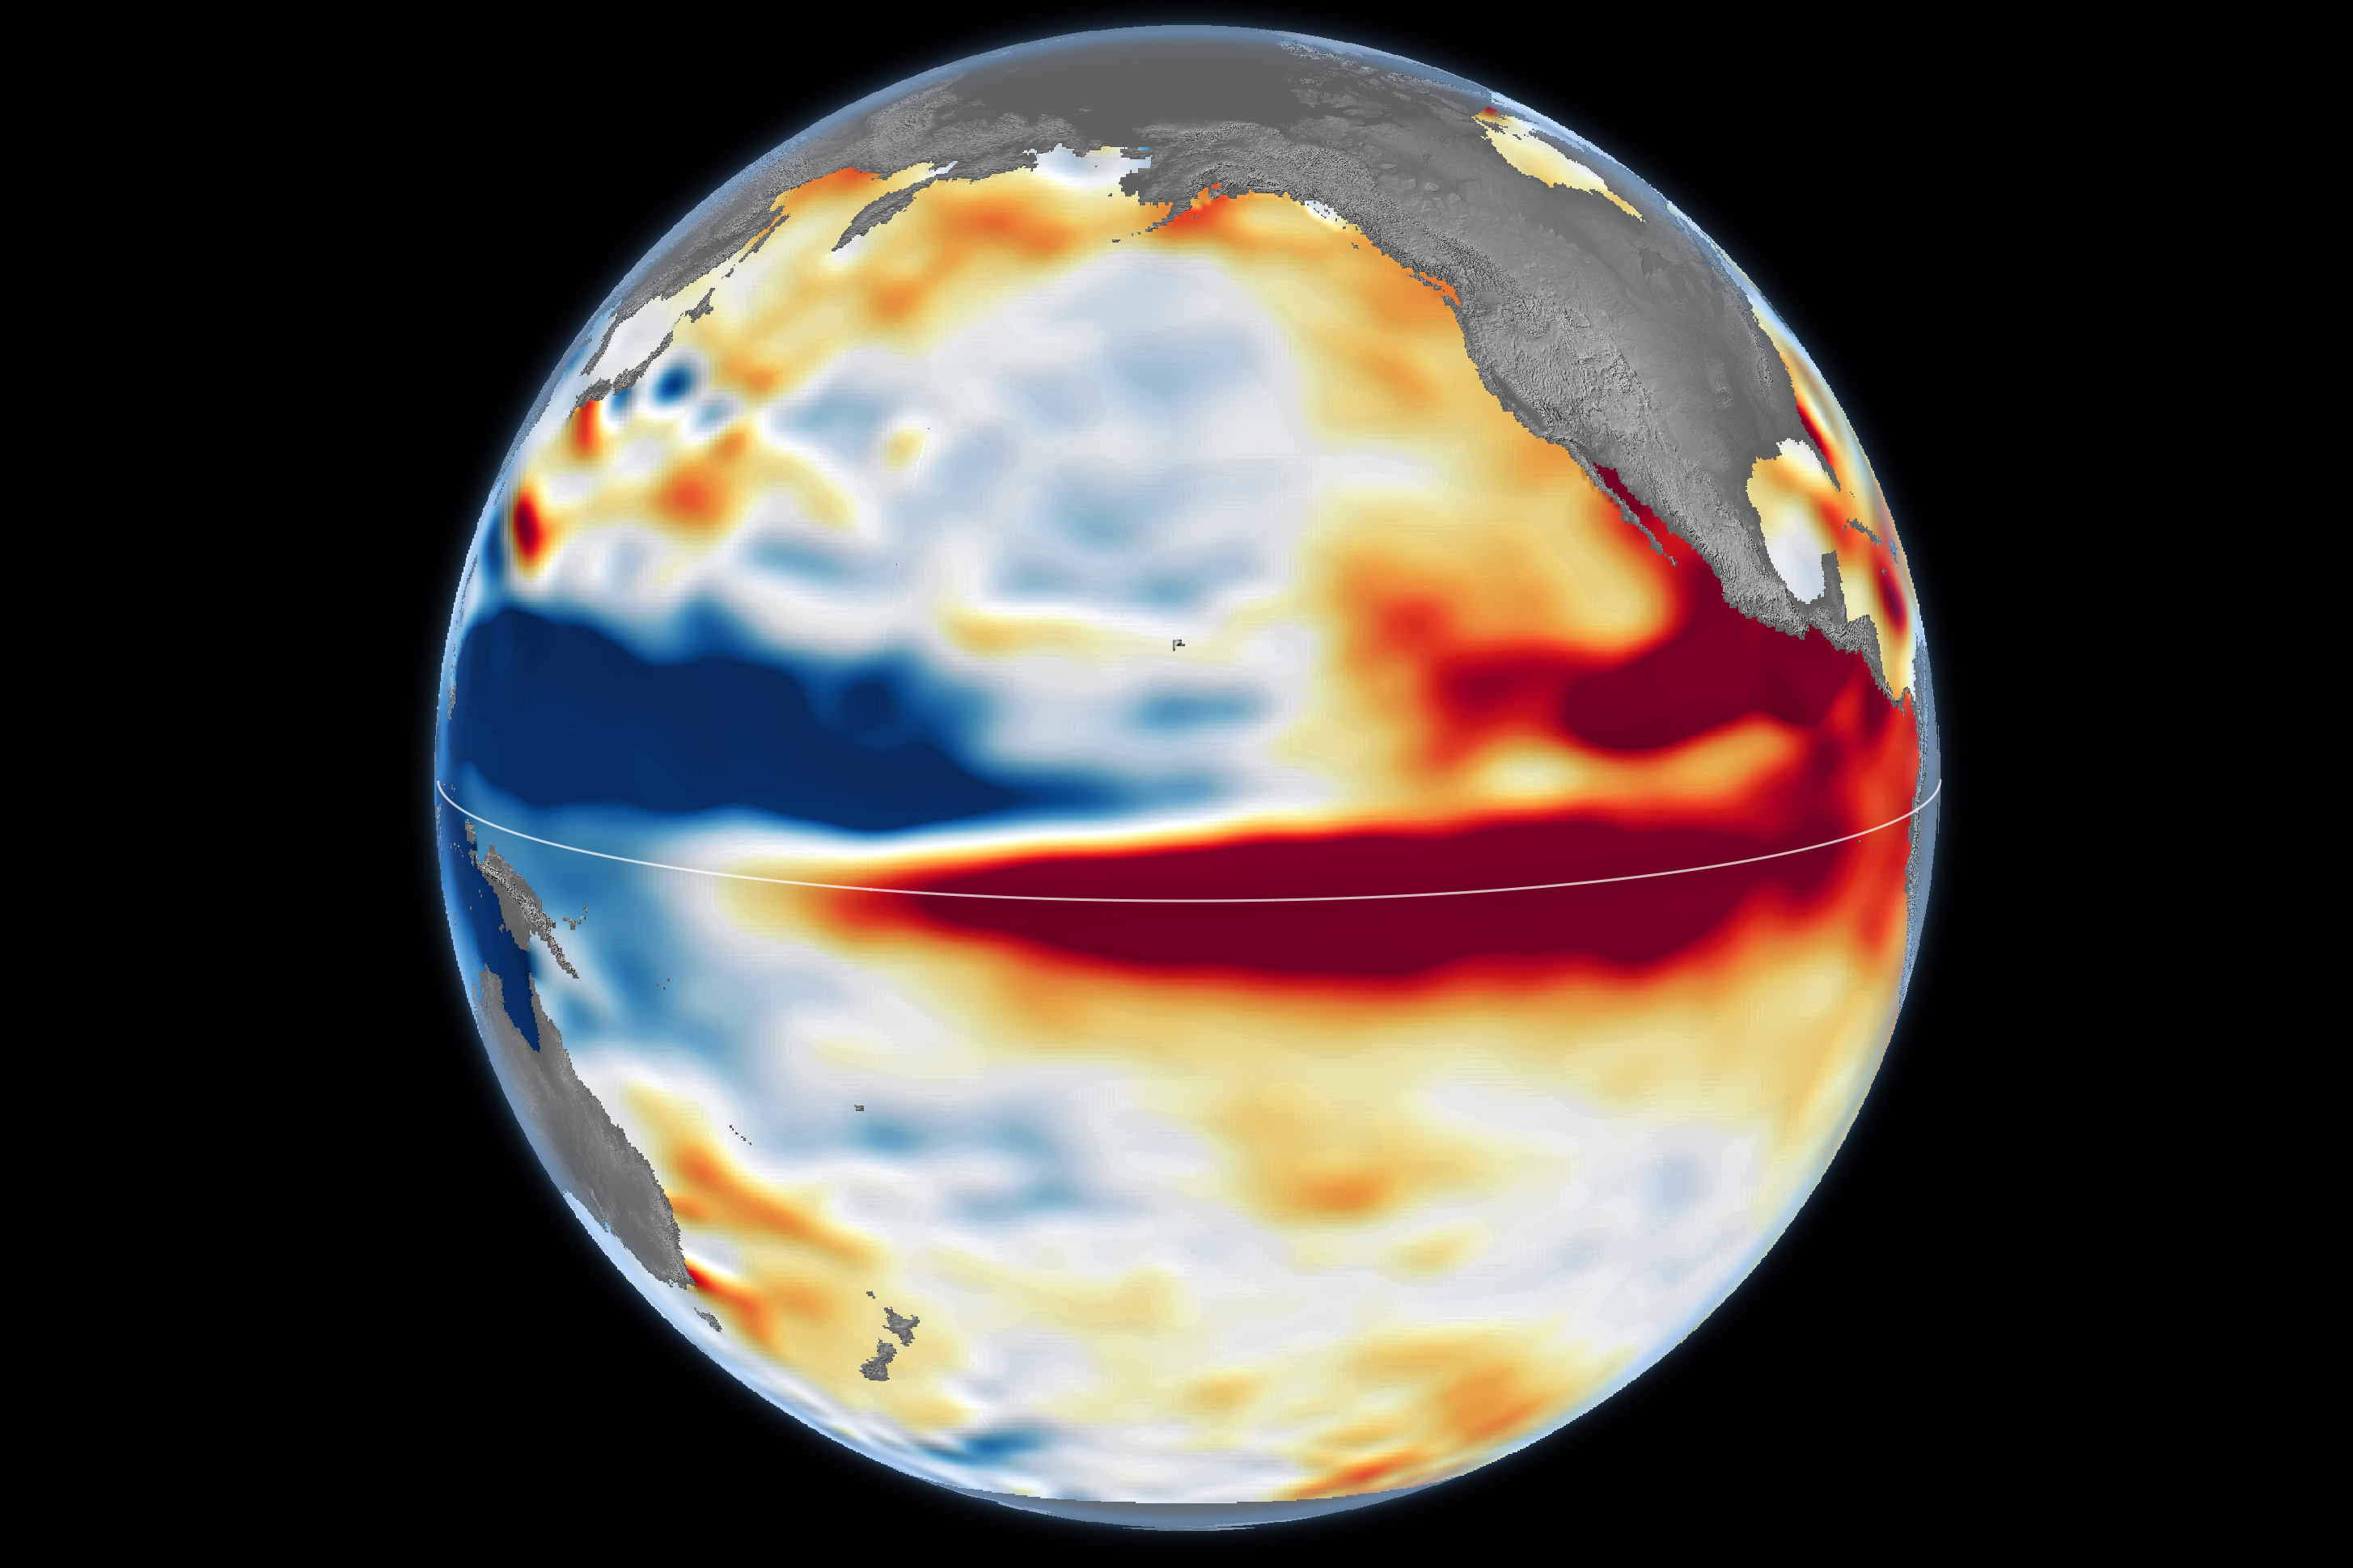
The equatorial Pacific is doing something that climatologists have seen very rarely since modern records began. In early October, NOAA's Climate Prediction Center (CPC) estimated at 83% the probability that the October-December 2026 quarter will register a "historic" El Niño, that is, more intense than any other since 1950. Two weeks later, NASA published a satellite comparison that made it visible: the sea level map of October 2026 looks a lot like that of October 1997, the year that remained synonymous with floods and millions of dollars in losses on the South American Pacific coast.
For South America, the question is no longer whether El Niño arrived — NOAA declared the event on June 11 and the Peruvian ENFEN has maintained the Coastal El Niño alert since February — but how long it will last and where it will hit hardest between November 2026 and the austral autumn of 2027.
📌 In 30 seconds
🛰️ NASA: The sea level of October 2026 shows a pattern similar to that of October 1997, with warm water reaching the South American coast. Its scientist Josh Willis believes that the event is on track to be even larger, although he warns that it will not be identical.
🌡️ NOAA and WMO: 83% chance of a historic event in October-December (NOAA) and an expected average anomaly of +3.7°C in the Niño 3.4 region (WMO).
🌊 Peru: The ENFEN sees a coastal El Niño of extraordinary magnitude likely between September 2026 and January 2027, with record temperatures and above-normal rainfall on the north coast since November.
🌧️ Chile and Argentina: official services anticipate above-normal rainfall for October-December in south-central Chile and in the Littoral and central Argentina.
⚠️ The nuance: these are probabilistic prognoses. An intense El Niño increases the risk of certain impacts, but does not guarantee them.
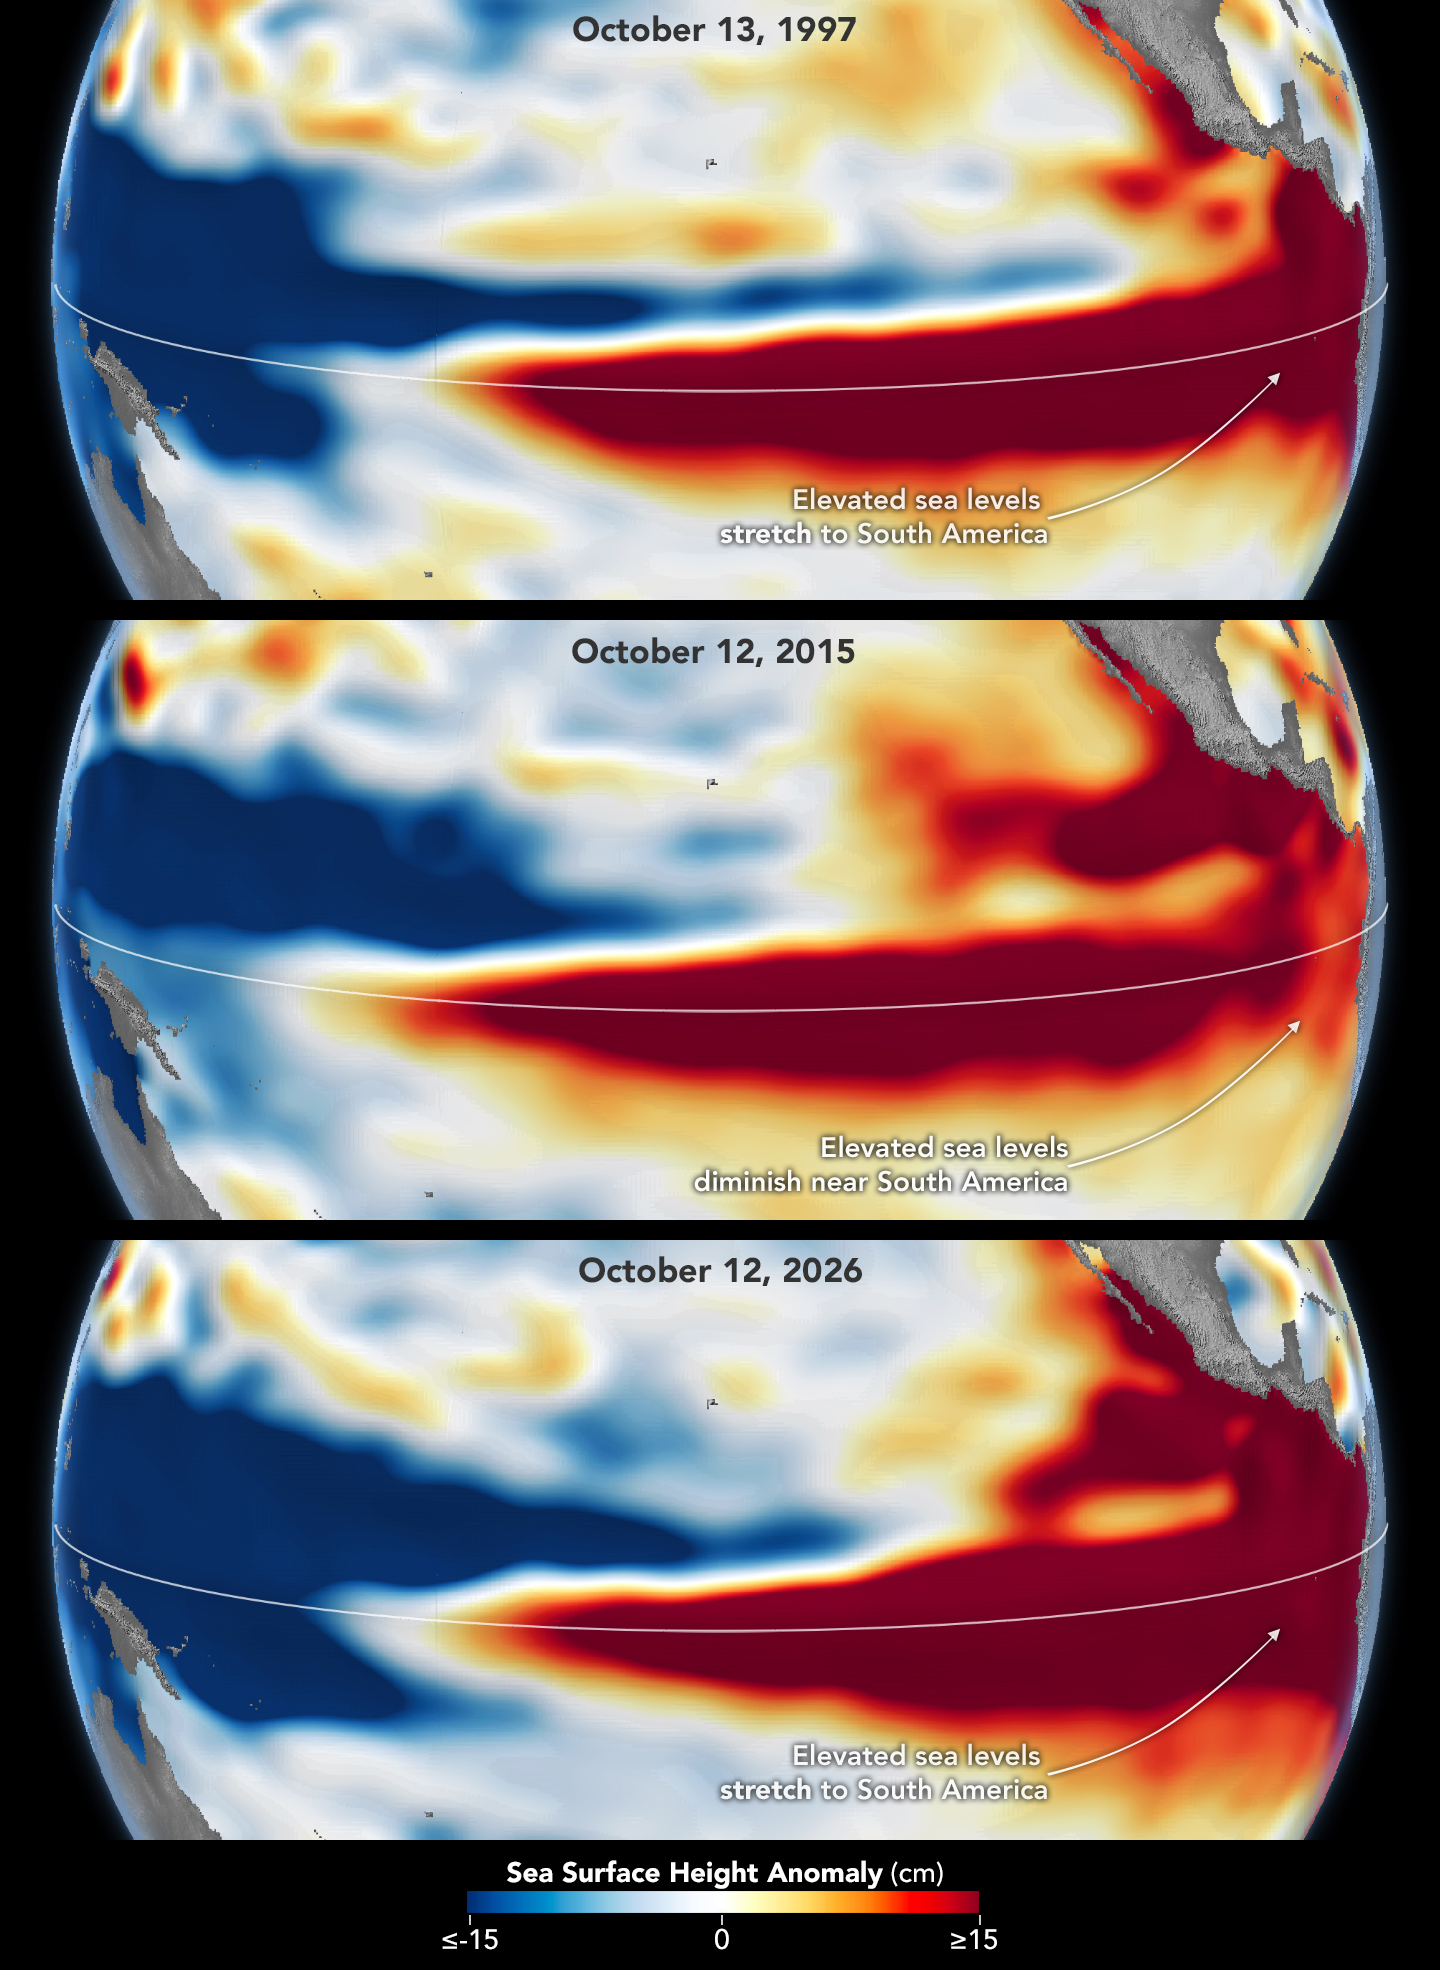
The NASA Earth Observatory analysis, published on October 23, is based on 35 years of satellite altimetry: almost identical missions that fly over the same trajectory and overlap with each other. This continuity allows us to compare three photographs of the ocean taken at the same time of year: October 13, 1997, October 12, 2015, and October 12, 2026.
In 1997 and 2026, the mass of high and warm water extends through the equatorial Pacific until it collides with the coast of South America. In 2015, another very strong event, that water stayed farther from the continent, which helps explain why the rains that winter were more concentrated in Central America and the southeastern United States, with flooding in Mexico.
Willis, a scientist at NASA's Jet Propulsion Laboratory (JPL), explained that this record allows us to look back and compare, and that the current event is on track to be even larger than the one in 1997. He also made two caveats: El Niño in 2026 erupted much more at once than the one in 1997-98, and looking like it doesn't mean repeating itself; it is, he said, the best estimate available for now.
That geographical detail is what matters in this part of the world. When warm water rests on the coast, the sea off Peru and Ecuador rises in temperature and level, and the warming is transmitted to the air. Kelvin waves, huge ocean waves that travel from west to east, carry that heat from the central Pacific.
|
Source
|
What it indicates
|
Date
|
|
NOAA/CPC
|
El Niño continues to strengthen. A strong to very strong event is likely until January-March 2027 (more than 83%). Chances of exceeding +2.5 °C in the quarterly RONI index: 54% for September-November, 83 % for October-December and 70 % for November-January. Last month's indices: Niño 3.4 at +2.1 °C, Niño 3 at +3.0 °C and Niño 1+2 at +3.9 °C.
|
Oct 8, 2026
|
|
OMM
|
Predicted average anomaly of +3.7 °C in Niño 3.4 for October-December, with a peak in December. Near 100% probability that El Niño will persist until February 2027.
|
Oct 8, 2026
|
|
NASA
|
October 2026 sea level maps similar to those from October 1997; the current event unfolded faster and, according to Willis, is on track to be even larger.
|
Oct 23, 2026
|
|
Copernicus
|
Sea surface temperature (60° S-60° N) of 21.05 °C in September: record for that month (the previous was 20.92 °C, in 2023) and fourth consecutive month of ocean record. September was 1.63 °C above the pre-industrial era.
|
Report of Sep. 2026
|
A technical detail that should be known: since October 8, NOAA has replaced the ERSSTv5 database with the ERSSTv6 and measures events with the RONI (relative oceanic El Niño index), which discounts the warming of the ocean floor in order to compare episodes from different decades.
• Fact: El Niño is present, it is getting stronger, and agencies agree that it will be at least strong, probably very strong.
• Probability: Outperforming all events since 1950 is a forecast, not a fait accompli. The CPC threshold is a quarterly RONI value of +2.5°C or higher, and its chance for October-December is 83%.
• Loose comparisons: the WMO +3.7°C figure and NOAA RONI thresholds measure different things. It's a good idea not to mix them up.
• Impacts: NOAA clarifies that, with an event of this magnitude, the typical effects of El Niño are more likely, but they are not guaranteed. Willis sums it up as a roll of the dice, because the signal is mixed up as it leaves the tropics.
• Climate change: According to the regional press, the WMO did not find conclusive evidence that global warming is intensifying these events. What does rise is the base: the sea sets records and the WMO considers it likely that 2027 will be the warmest year on record. Berkeley Earth, for its part, places the chance that 2026 will surpass the 2024 record at 69%.
The same El Niño produces very different effects along thousands of kilometers of coastline and mountain ranges, and not all of them can be summarized as "hotter". The most extreme thermal signal is concentrated in the sea and on the northern coast of the South American Pacific; in central Argentina and Chile, on the other hand, official forecasts point to maximums and averages below normal, due to the effect of cloudiness and rainfall.
|
Country
|
Thermal signal
|
Rain sign
|
Source
|
|
Peru
|
Air well above normal on the coast between September and November, with possible records; warm sea.
|
Above normal on the north coast, with moderate to strong episodes since November; deficit and irregularity in the southern highlands.
|
ENFEN, Senamhi
|
|
Ecuador
|
Sea level about 40 cm above normal in August (in 1997 it reached 42-47 cm).
|
More frequent and intense around November and December 2026 on the Coast.
|
INAMHI, CN-ERFEN, Inocar
|
|
Chile
|
Maximum temperatures below normal in much of the center-south; north warmer and drier.
|
Above normal from part of Coquimbo to Los Ríos (Oct-Dec); drier southern end.
|
Chilean Meteorological Directorate
|
|
Argentina
|
Averages below normal in much of Cuyo, Córdoba, west of Santa Fe, La Pampa and west of Buenos Aires (Oct-Dec).
|
Above normal in the Littoral (highest probability), Córdoba, west of Santa Fe, Cuyo, La Pampa and west of Buenos Aires; lower west of the NOA.
|
SMN
|
The National Study of the El Niño Phenomenon (ENFEN) projected in its mid-September statement that coastal El Niño would continue until mid-fall 2027, with the highest probability of extraordinary magnitude between September 2026 and January 2027. For the summer of December to March, it assigned 48% to an extraordinary magnitude and 45% to a strong one.
• Heat: Senamhi and ENFEN predict air temperatures much higher than usual throughout the coast during the spring, with possible new records; the press reports projections of up to 5 °C above normal. Piura already marked 34.2 °C on July 12, above the record of 33.4 °C in July 1997.
• Rainfall: above normal on the north coast, with episodes of moderate to strong intensity since November. Senamhi expects the first significant rainfall between the end of October and November, with the possibility of extending to Lima and Ica.
• Two faces: the "global" El Niño of the central Pacific, peaking between October and December, can bring irregularity and drought in the southern highlands and the eastern slopes, while the northern coast receives excess water.
• Fishing: the anchovy would continue to stick to the coastal strip and at greater depths in the north-central area.
• Other sectors: Senamhi warns of possible effects on agriculture, livestock and health due to high temperatures and the change in rainfall regime.
The National Committee for the Regional Study of the El Niño Phenomenon (CN-ERFEN) reported on August 20 an anomaly of 40 centimeters in the mean sea level in coastal stations, close to 42 to 47 centimeters in 1997-98. At the beginning of September, the Inocar registered values of between 28 and 33 centimeters. With the sea high, the mouths of rivers and drains slow down and the risk of flooding is aggravated when it rains.
INAMHI links an increase in rainfall in frequency and intensity to El Niño as November and December 2026 approach. The institute also clarified that the heavy downpours on August 17 in Guayaquil did not correspond to El Niño, and placed its full influence at the end of 2026 and the beginning of 2027. Authorities are already monitoring coastal erosion and the effect on hydroelectric generation.
The Chilean Meteorological Directorate (DMC) projects above-normal rainfall for October-December from part of Coquimbo to Los Ríos, below-normal maximums in much of the center-south, a drier and warmer north and a drier southern end. The DMC expects El Niño to have its maximum between October and November and to remain until the fall of 2027.
There are cautions. Academic Pablo Sarricolea, from the University of Chile and CR2, recalled that the relationship between El Niño and rainfall in Chile is not automatic, and the DMC itself clarified that "super Niño" is a media denomination, not an official scientific category. By the middle of the year, moreover, the phenomenon was already present but large rains had not yet appeared.
The National Meteorological Service (SMN), in its September 30 forecast for October-December, gives the highest probability of above-normal rainfall to the Litoral, and extends the humid signal to the west of Santa Fe, Córdoba, the center-south of Cuyo, La Pampa, the west of Buenos Aires and the northeast of Patagonia. In the west of the NOA, below-normal rainfall is expected. Average temperatures would tend to be below normal in much of Cuyo, Córdoba, western Santa Fe, La Pampa and western Buenos Aires.
The SMN confirmed that El Niño is active and that the probability of continuity is close to 100%. It also stresses that its quarterly forecast describes an average behavior: it does not anticipate the intensity or duration of each event, nor which city will suffer a storm or flood. That is why it recommends following its early warning system as the months of greatest impact approach.
The numbers of the last major event explain the concern. According to CAF, El Niño in 1997-98 generated losses in the order of US$ 7,500 million throughout the Andean region. In Peru, official estimates place the damage at about US$ 3,500 million, equivalent to 6.2% of GDP in 1998. In Ecuador, ECLAC calculated losses of US$ 2,882 million, 14.6% of GDP in 1997, and about seven million people, 60% of the population at the time, experienced direct or indirect impacts. The figures vary depending on the source and methodology.
There is a nuance about the type of damage: in Ecuador, the productive sector absorbed 52.8% of the losses of 1997-98, and for every dollar of direct material damage there were about 2.66 dollars of indirect losses due to lost income.
• November 12: New monthly CPC/NOAA discussion, with updated probabilities.
• Communiqués from ENFEN and Senamhi (Peru), which are issued biweekly.
• Warnings from INAMHI and CN-ERFEN (Ecuador) on rainfall and sea level.
• Seasonal forecast from the DMC (Chile) and quarterly forecast and alerts from the SMN (Argentina).
✅ Bear in mind
A seasonal forecast does not say which day or in which neighborhood it will rain. For specific decisions — irrigation, planting, drainage, navigation, travel — it is advisable to consult the official short-term alerts of your country and review the contingency plans of homes, businesses and establishments before the months of greatest risk begin.
It is a journalistic name for events of very strong intensity. The Chilean Meteorological Directorate clarifies that it is not an official scientific category; NOAA speaks of strong or very strong events according to the RONI quarterly index.
It cannot yet be confirmed. NASA observes an ocean pattern very similar to that of October 1997 and its scientist believes that it could end up being higher, and NOAA gives 83% chance of a historic event in October-December. But these are forecasts: the final intensity will be known when the quarterly averages are consolidated.
NOAA expects it to persist through March-May 2027, with favorable neutral conditions toward April-July. The WMO sees near 100% probability of continuity through February 2027, and the NFENS and DMC project effects through the austral fall of 2027.
The risk increases where forecasts call for above-normal rainfall: the northern coast of Peru, the coast of Ecuador, central and south-central Chile, and the Argentine coast. But quarterly forecasts are averages and do not indicate where or when a specific storm will hit.
A typical El Niño adds 0.1 to 0.2 °C to the global average, with a peak about three months after its peak. That is why the WMO considers 2027 likely to be a new record year.
Transparency note: this article was prepared with official sources and specialized press consulted on October 24, 2026. Forecasts are updated permanently and figures may vary.
All sources were consulted on October 24, 2026.
1. NOAA / Climate Prediction Center — ENSO Diagnostic Discussion (8 oct 2026)
2. NASA Earth Observatory — El Niño Then and Now (23 oct 2026)
3. Infobae — El Niño of 2026 under NASA's magnifying glass (Oct 23, 2026)
4. Europa Press / Article 14 — WMO forecasts anomaly of up to +3.7°C (8 Oct 2026)
5. El Economista — September 2026 was the second warmest; Copernicus data
6. Meteored — WMO warns of more heat records coming
7. Mercado Magazine — Berkeley Earth and the chance of a record in 2026
8. Pantel — Super El Niño: What Makes It Stronger Than Ever in 2026?
9. El Búho — ENFEN: The Extraordinary Coastal El Niño until May 2027 (15 Sep 2026)
10. Management — ENFEN maintains the state of alert until mid-autumn 2027
11. Caretas — Peruvian coast with temperatures up to 5 °C above normal
12. RPP — Temperature record in Piura (Senamhi)
13. América TV — Senamhi: peak of the Global Niño at the end of the year
14. Scoops — Sea Level Rises 40 cm in Ecuador (CN-ERFEN)
15. El Comercio (Ecuador) — INAMHI forecasts increased rainfall due to El Niño (Sept. 14, 2026)
16. El Comercio (Ecuador) — INAMHI rules out that the August rains are due to El Niño
17. Meteored Chile — DMC anticipates a rainier end of 2026 in central Chile
18. CNN Chile — DMC predicts that the peak of El Niño will be between October and November
19. The Clinic — Winter Arrives with the Influence of El Niño (Sarricolea)
20. BioBioChile — DMC clarifies that "super Niño" is not an official category
21. SMN Argentina — Quarterly Climate Forecast Oct-Dec 2026 (PDF)
22. Profile — The SMN anticipated above-normal rainfall for Oct-Dec 2026
23. Andina — Impact of El Niño in Peru: 1982-83, 1997-98 and 2017
24. EY Peru — El Niño phenomenon: can its impact be reduced? (CAF figures)
25. Scoops — El Niño 1997-98 in Ecuador (ECLAC)
26. Scoops — Losses for the Ecuadorian productive sector
🔗 Where to follow it in real time (official bodies)
• NOAA / CPC: https://www.cpc.ncep.noaa.gov/products/analysis_monitoring/enso_advisory/ensodisc.shtml
• ENFEN (Peru): https://enfen.imarpe.gob.pe
• Senamhi (Peru): https://www.senamhi.gob.pe
• SMN (Argentina) — El Niño: https://www.smn.gob.ar/enos
• SMN (Argentina) — Alerts: https://www.smn.gob.ar/alertas
🛠️ SEO Technical Annex and Publication (Do Not Publish)
⚙️ Instructions
This section is for the blog editor only. Replace the UPPERCASE texts (domain, author, blog name, logo) and fill in the actual height of each image before publishing.
1. SEO Sheet
|
Field
|
Recommended value
|
|
Primary Keyword
|
El Niño 2026
|
|
Secondaries/Entities
|
El Niño super; El Niño 1997 comparison; El Niño Costero ENFEN; El Niño El Niño forecast; El Niño rains Argentina; El Niño Peru Ecuador Chile Argentina; RONI; NOAA CPC; WMO
|
|
Long tail (questions)
|
is El Niño 2026 stronger than the one in 1997?; when does El Niño 2026 end?; how does El Niño affect Argentina in summer?; what is a super El Niño?
|
|
Search intent
|
Informative / current news (suitable for Top Stories and Discover)
|
|
Title tag (50 car.)
|
Super El Niño 2026 vs 1997: impacts in South America
|
|
Meta description (140 car.)
|
NASA compares El Niño in 2026 with that of 1997 and NOAA predicts a historic event. What Peru, Ecuador, Chile and Argentina expect until 2027.
|
|
Slug
|
/super-el-niño-2026-vs-1997-peru-ecuador-chile-argentina/
|
|
Structure
|
A single H1 with the keyword; H2 per thematic block; H3 per country and per FAQ; index with anchor links
|
|
Featured image
|
Minimum 1200px wide (NASA is 1280px), 16:9 format or similar, with descriptive alt
|
|
Schematics
|
NewsArticle + FAQPage (JSON-LD más abajo)
|
|
Freshness (E-E-A-T)
|
Update the article and dateModified after November 12 (CPC) and each statement from ENFEN, the SMN and the DMC. Keep primary sources cited and author with profile.
|
|
Internal Linking
|
Link to and from your own articles on climate, agriculture, fishing, economy and rainfall preparedness guides; use descriptive anchors, not "click here".
|
|
Performance (Core Web Vitals)
|
WebP/AVIF images with defined width and height, loading=lazy except for the cover, font with display=swap and preconnect.
|
2. Labels for the <head>
<!-- Font -->
<link rel="preconnect" href="https://fonts.googleapis.com">
<link rel="preconnect" href="https://fonts.gstatic.com" crossorigin>
<link href="https://fonts.googleapis.com/css2?family=Montserrat:wght@400;600;700;800&display=swap" rel="stylesheet">
<!-- Basic SEO -->
<title>Super El Niño 2026 vs 1997: impacts in South America</title>
<meta name="description" content="NASA compares El Niño in 2026 with that of 1997 and NOAA predicts a historic event. What do Peru, Ecuador, Chile and Argentina expect until 2027." >
<meta name="robots" content="index, follow, max-image-preview:large, max-snippet:-1">
<link rel="canonical" href="https://midire.ar/super-el-nino-2026-vs-1997-peru-ecuador-chile-argentina/">
<link rel="alternate" hreflang="es" href="https://Midire.ar/super-el-nino-2026-vs-1997-peru-ecuador-chile-argentina/">
<!-- Open Graph / Twitter -->
<meta property="og:type" content="article">
<meta property="og:title" content="Super El Niño 2026 vs 1997: impacts in South America">
<meta property="og:description" content="NASA compares El Niño in 2026 with that of 1997 and NOAA predicts a historic event. What do Peru, Ecuador, Chile and Argentina expect until 2027." >
<meta property="og:url" content="https://Midire.ar/super-el-nino-2026-vs-1997-peru-ecuador-chile-argentina/">
<meta property="og:image" content="https://assets.science.nasa.gov/content/dam/science/esd/eo/images/iotd/2026/el-ni%C3%B1o-then-and-now/elninocomp_sen6_20261012_th.jpg/jcr:content/renditions/cq5dam.web.1280.1280.jpeg">
<meta property="og:locale" content="es_AR">
<meta property="article:published_time" content="2026-10-24T20:40:00-03:00">
<meta name="twitter:card" content="summary_large_image">
3. Structured Data (JSON-LD)
<script type="application/ld+json">
{
"@context": "https://schema.org",
"@type": "NewsArticle",
"mainEntityOfPage": {
"@type": "WebPage",
"@id": "https://Midire.ar/super-el-nino-2026-vs-1997-peru-ecuador-chile-argentina/"
},
"headline": "Super El Niño 2026: the Pacific warms up like in 1997 and South America enters a countdown",
"description": "NASA compares El Niño in 2026 with that of 1997 and NOAA predicts a historic event. What do Peru, Ecuador, Chile and Argentina expect until 2027.",
"image": [
"https://assets.science.nasa.gov/content/dam/science/esd/eo/images/iotd/2026/el-ni%C3%B1o-then-and-now/elninocomp_sen6_20261012_th.jpg/jcr:content/renditions/cq5dam.web.1280.1280.jpeg"
],
"datePublished": "2026-10-24T20:40:00-03:00",
"dateModified": "2026-10-24T20:40:00-03:00",
"inLanguage": "es",
"articleSection": "Clima",
"keywords": "El Niño 2026, super El Niño, El Niño 1997, ENFEN, SMN, Peru, Ecuador, Chile, Argentina",
"author": {
"@type": "Person",
"name": "Cronywell",
"url": "https://Midire.ar/autor/"
},
"publisher": {
"@type": "Organization",
"name": "Pi-MiDire",
"logo": {
"@type": "ImageObject",
"url": "https://Midire.ar/logo.png"
}
}
}
</script>
<script type="application/ld+json">
{
"@context": "https://schema.org",
"@type": "FAQPage",
"mainEntity": [
{
"@type": "Question",
"name": "What is a "super El Niño"?"
"acceptedAnswer": {
"@type": "Answer",
"text": "It is a journalistic name for events of very strong intensity. The Chilean Meteorological Directorate clarifies that it is not an official scientific category; NOAA speaks of strong or very strong events according to the quarterly RONI index."
}
},
{
"@type": "Question",
"name": "Is the El Niño of 2026 stronger than the one of 1997?"
"acceptedAnswer": {
"@type": "Answer",
"text": "It can't be said yet. NASA observes an ocean pattern very similar to that of October 1997 and its scientist believes that it could end up being higher, and NOAA gives an 83% chance of a historic event in October-December. But they are forecasts: the final intensity will be known when the quarterly averages are consolidated."
}
},
{
"@type": "Question",
"name": "How long will El Niño last?"
"acceptedAnswer": {
"@type": "Answer",
"text": "NOAA expects it to persist through March-May 2027, with favorable neutral conditions towards April-July. WMO sees near 100% probability of continuity through February 2027, and NFENS and DMC project effects through austral autumn 2027."
}
},
{
"@type": "Question",
"name": "Will there be floods in Peru, Ecuador, Chile and Argentina?",
"acceptedAnswer": {
"@type": "Answer",
"text": "The risk increases where forecasts mark above-normal rainfall: the northern coast of Peru, the coast of Ecuador, central and south-central Chile, and the Argentine coast. But quarterly forecasts are averages and do not indicate where or when a specific storm will strike."
}
},
{
"@type": "Question",
"name": "How does El Niño influence global temperature?",
"acceptedAnswer": {
"@type": "Answer",
"text": "A typical El Niño adds 0.1 to 0.2 °C to the global average, peaking about three months after its peak. That is why the WMO considers it likely that 2027 will be a new record year."
}
}
]
}
</script>
4. CSS responsive with Montserrat typography
body{font-family:'Montserrat',system-ui,-apple-system,'Segoe UI',Arial,sans-serif; line-height:1.7; margin:0}
article{max-width:720px; margin:0 auto; padding:0 16px}
article img{max-width:100%; height:auto; display:block}
article table{display:block; overflow-x:auto; border-collapse:collapse; width:100%}
h1{font-size:clamp(1.6rem,4.5vw,2.4rem); line-height:1.2}
@media (max-width:600px){article{padding:0 14px}}
5. Images with absolute link (HTML ready to paste)
<figure>
<img src="https://assets.science.nasa.gov/content/dam/science/esd/eo/images/iotd/2026/el-ni%C3%B1o-then-and-now/elninocomp_sen6_20261012_th.jpg/jcr:content/renditions/cq5dam.web.1280.1280.jpeg" alt="Pacific satellite map with positive sea level anomalies to the coast of South America, October 2026" loading="lazy" decoding="async" width="1280" height="ADJUST">
<figcaption>Pacific sea level, October 12, 2026. Credit: NASA Earth Observatory/Lauren Dauphin.</figcaption>
</figure>
<figure>
<img src="https://assets.science.nasa.gov/content/dam/science/esd/eo/images/iotd/2026/el-ni%C3%B1o-then-and-now/elninocomp_sen6_19971013_lrg.jpg" alt="Pacific Sea Level Map, October 13, 1997" loading="lazy" decoding="async" width="1280" height="ADJUST">
<figcaption>Sea level, October 13, 1997. Credit: NASA Earth Observatory/Lauren Dauphin.</figcaption>
</figure>
<figure>
<img src="https://assets.science.nasa.gov/content/dam/science/esd/eo/images/iotd/2026/el-ni%C3%B1o-then-and-now/elninocomp_sen6_20261012_lrg.jpg" alt="Pacific Sea Level Map, October 12, 2026" loading="lazy" decoding="async" width="1280" height="ADJUST">
<figcaption>Sea Level, October 12, 2026. Credit: NASA Earth Observatory/Lauren Dauphin.</figcaption>
</figure>
<figure>
<img src="https://assets.science.nasa.gov/content/dam/science/esd/eo/images/iotd/2026/el-ni%C3%B1o-then-and-now/elninotriptych_sen6_20261012.jpg" alt="Three stacked maps comparing sea level in October 1997, 2015 and 2026" loading="lazy" decoding="async" width="1280" height="ADJUST">
<figcaption>Octubre de 1997, 2015 y 2026. Crédito: NASA Earth Observatory / Lauren Dauphin.</figcaption>
</figure>
⚠️ Image Verification
The URLs of images correspond to those that NASA publishes in its note "El Niño Then and Now". I could not open them from my work environment, so it is advisable to verify that they load before publishing. To avoid broken links or consumption of third-party bandwidth, the ideal is to download them and host them on your own server. Also review NASA's media usage guidelines and keep the credit.
Typeface: Montserrat (Google Fonts) — https://fonts.google.com/specimen/Montserrat. If it's not installed on your computer, Word will display a replacement font; install it to see the original layout.
CLIMATE · SOUTH AMERICA · EL NIÑO 2026
Super El Niño 2026: the Pacific warms up like in 1997 and South America counts down
NASA satellites, NOAA and WMO forecasts agree: the current event resembles the historic one of 1997-98 and could surpass it. Peru and Ecuador are already feeling the heat of the sea; Chile and Argentina are preparing for a spring and summer with more rain than normal.
✍️ By Redacción · 📅 Saturday, October 24, 2026 · 🔄 Updated 24/10/2026, 20:40 (ART) · 🕒 Reading time: 13 min
📑 In this article
• 🛰️ What the Satellites See: The 1997 Mirror
• 🌡️ The official numbers
• 🔎 Stronger than 1997? What can be said and what cannot be said
• 🌎 Expected impacts, country by country
• 💰 The precedent: what it cost 1997-98
• 🧭 What to watch in the coming weeks
• ❓ Frequently asked questions about El Niño 2026
The equatorial Pacific is doing something that climatologists have seen very rarely since modern records began. In early October, NOAA's Climate Prediction Center (CPC) estimated at 83% the probability that the October-December 2026 quarter will register a "historic" El Niño, that is, more intense than any other since 1950. Two weeks later, NASA published a satellite comparison that made it visible: the sea level map of October 2026 looks a lot like that of October 1997, the year that remained synonymous with floods and millions of dollars in losses on the South American Pacific coast.
For South America, the question is no longer whether El Niño arrived — NOAA declared the event on June 11 and the Peruvian ENFEN has maintained the Coastal El Niño alert since February — but how long it will last and where it will hit hardest between November 2026 and the austral autumn of 2027.
📌 In 30 seconds
🛰️ NASA: The sea level of October 2026 shows a pattern similar to that of October 1997, with warm water reaching the South American coast. Its scientist Josh Willis believes that the event is on track to be even larger, although he warns that it will not be identical.
🌡️ NOAA and WMO: 83% chance of a historic event in October-December (NOAA) and an expected average anomaly of +3.7°C in the Niño 3.4 region (WMO).
🌊 Peru: The ENFEN sees a coastal El Niño of extraordinary magnitude likely between September 2026 and January 2027, with record temperatures and above-normal rainfall on the north coast since November.
🌧️ Chile and Argentina: official services anticipate above-normal rainfall for October-December in south-central Chile and in the Littoral and central Argentina.
⚠️ The nuance: these are probabilistic prognoses. An intense El Niño increases the risk of certain impacts, but does not guarantee them.
The NASA Earth Observatory analysis, published on October 23, is based on 35 years of satellite altimetry: almost identical missions that fly over the same trajectory and overlap with each other. This continuity allows us to compare three photographs of the ocean taken at the same time of year: October 13, 1997, October 12, 2015, and October 12, 2026.
In 1997 and 2026, the mass of high and warm water extends through the equatorial Pacific until it collides with the coast of South America. In 2015, another very strong event, that water stayed farther from the continent, which helps explain why the rains that winter were more concentrated in Central America and the southeastern United States, with flooding in Mexico.
Willis, a scientist at NASA's Jet Propulsion Laboratory (JPL), explained that this record allows us to look back and compare, and that the current event is on track to be even larger than the one in 1997. He also made two caveats: El Niño in 2026 erupted much more at once than the one in 1997-98, and looking like it doesn't mean repeating itself; it is, he said, the best estimate available for now.
That geographical detail is what matters in this part of the world. When warm water rests on the coast, the sea off Peru and Ecuador rises in temperature and level, and the warming is transmitted to the air. Kelvin waves, huge ocean waves that travel from west to east, carry that heat from the central Pacific.
|
Source
|
What it indicates
|
Date
|
|
NOAA/CPC
|
El Niño continues to strengthen. A strong to very strong event is likely until January-March 2027 (more than 83%). Chances of exceeding +2.5 °C in the quarterly RONI index: 54% for September-November, 83 % for October-December and 70 % for November-January. Last month's indices: Niño 3.4 at +2.1 °C, Niño 3 at +3.0 °C and Niño 1+2 at +3.9 °C.
|
Oct 8, 2026
|
|
OMM
|
Predicted average anomaly of +3.7 °C in Niño 3.4 for October-December, with a peak in December. Near 100% probability that El Niño will persist until February 2027.
|
Oct 8, 2026
|
|
NASA
|
October 2026 sea level maps similar to those from October 1997; the current event unfolded faster and, according to Willis, is on track to be even larger.
|
Oct 23, 2026
|
|
Copernicus
|
Sea surface temperature (60° S-60° N) of 21.05 °C in September: record for that month (the previous was 20.92 °C, in 2023) and fourth consecutive month of ocean record. September was 1.63 °C above the pre-industrial era.
|
Report of Sep. 2026
|
A technical detail that should be known: since October 8, NOAA has replaced the ERSSTv5 database with the ERSSTv6 and measures events with the RONI (relative oceanic El Niño index), which discounts the warming of the ocean floor in order to compare episodes from different decades.
• Fact: El Niño is present, it is getting stronger, and agencies agree that it will be at least strong, probably very strong.
• Probability: Outperforming all events since 1950 is a forecast, not a fait accompli. The CPC threshold is a quarterly RONI value of +2.5°C or higher, and its chance for October-December is 83%.
• Loose comparisons: the WMO +3.7°C figure and NOAA RONI thresholds measure different things. It's a good idea not to mix them up.
• Impacts: NOAA clarifies that, with an event of this magnitude, the typical effects of El Niño are more likely, but they are not guaranteed. Willis sums it up as a roll of the dice, because the signal is mixed up as it leaves the tropics.
• Climate change: According to the regional press, the WMO did not find conclusive evidence that global warming is intensifying these events. What does rise is the base: the sea sets records and the WMO considers it likely that 2027 will be the warmest year on record. Berkeley Earth, for its part, places the chance that 2026 will surpass the 2024 record at 69%.
The same El Niño produces very different effects along thousands of kilometers of coastline and mountain ranges, and not all of them can be summarized as "hotter". The most extreme thermal signal is concentrated in the sea and on the northern coast of the South American Pacific; in central Argentina and Chile, on the other hand, official forecasts point to maximums and averages below normal, due to the effect of cloudiness and rainfall.
|
Country
|
Thermal signal
|
Rain sign
|
Source
|
|
Peru
|
Air well above normal on the coast between September and November, with possible records; warm sea.
|
Above normal on the north coast, with moderate to strong episodes since November; deficit and irregularity in the southern highlands.
|
ENFEN, Senamhi
|
|
Ecuador
|
Sea level about 40 cm above normal in August (in 1997 it reached 42-47 cm).
|
More frequent and intense around November and December 2026 on the Coast.
|
INAMHI, CN-ERFEN, Inocar
|
|
Chile
|
Maximum temperatures below normal in much of the center-south; north warmer and drier.
|
Above normal from part of Coquimbo to Los Ríos (Oct-Dec); drier southern end.
|
Chilean Meteorological Directorate
|
|
Argentina
|
Averages below normal in much of Cuyo, Córdoba, west of Santa Fe, La Pampa and west of Buenos Aires (Oct-Dec).
|
Above normal in the Littoral (highest probability), Córdoba, west of Santa Fe, Cuyo, La Pampa and west of Buenos Aires; lower west of the NOA.
|
SMN
|
The National Study of the El Niño Phenomenon (ENFEN) projected in its mid-September statement that coastal El Niño would continue until mid-fall 2027, with the highest probability of extraordinary magnitude between September 2026 and January 2027. For the summer of December to March, it assigned 48% to an extraordinary magnitude and 45% to a strong one.
• Heat: Senamhi and ENFEN predict air temperatures much higher than usual throughout the coast during the spring, with possible new records; the press reports projections of up to 5 °C above normal. Piura already marked 34.2 °C on July 12, above the record of 33.4 °C in July 1997.
• Rainfall: above normal on the north coast, with episodes of moderate to strong intensity since November. Senamhi expects the first significant rainfall between the end of October and November, with the possibility of extending to Lima and Ica.
• Two faces: the "global" El Niño of the central Pacific, peaking between October and December, can bring irregularity and drought in the southern highlands and the eastern slopes, while the northern coast receives excess water.
• Fishing: the anchovy would continue to stick to the coastal strip and at greater depths in the north-central area.
• Other sectors: Senamhi warns of possible effects on agriculture, livestock and health due to high temperatures and the change in rainfall regime.
The National Committee for the Regional Study of the El Niño Phenomenon (CN-ERFEN) reported on August 20 an anomaly of 40 centimeters in the mean sea level in coastal stations, close to 42 to 47 centimeters in 1997-98. At the beginning of September, the Inocar registered values of between 28 and 33 centimeters. With the sea high, the mouths of rivers and drains slow down and the risk of flooding is aggravated when it rains.
INAMHI links an increase in rainfall in frequency and intensity to El Niño as November and December 2026 approach. The institute also clarified that the heavy downpours on August 17 in Guayaquil did not correspond to El Niño, and placed its full influence at the end of 2026 and the beginning of 2027. Authorities are already monitoring coastal erosion and the effect on hydroelectric generation.
The Chilean Meteorological Directorate (DMC) projects above-normal rainfall for October-December from part of Coquimbo to Los Ríos, below-normal maximums in much of the center-south, a drier and warmer north and a drier southern end. The DMC expects El Niño to have its maximum between October and November and to remain until the fall of 2027.
There are cautions. Academic Pablo Sarricolea, from the University of Chile and CR2, recalled that the relationship between El Niño and rainfall in Chile is not automatic, and the DMC itself clarified that "super Niño" is a media denomination, not an official scientific category. By the middle of the year, moreover, the phenomenon was already present but large rains had not yet appeared.
The National Meteorological Service (SMN), in its September 30 forecast for October-December, gives the highest probability of above-normal rainfall to the Litoral, and extends the humid signal to the west of Santa Fe, Córdoba, the center-south of Cuyo, La Pampa, the west of Buenos Aires and the northeast of Patagonia. In the west of the NOA, below-normal rainfall is expected. Average temperatures would tend to be below normal in much of Cuyo, Córdoba, western Santa Fe, La Pampa and western Buenos Aires.
The SMN confirmed that El Niño is active and that the probability of continuity is close to 100%. It also stresses that its quarterly forecast describes an average behavior: it does not anticipate the intensity or duration of each event, nor which city will suffer a storm or flood. That is why it recommends following its early warning system as the months of greatest impact approach.
The numbers of the last major event explain the concern. According to CAF, El Niño in 1997-98 generated losses in the order of US$ 7,500 million throughout the Andean region. In Peru, official estimates place the damage at about US$ 3,500 million, equivalent to 6.2% of GDP in 1998. In Ecuador, ECLAC calculated losses of US$ 2,882 million, 14.6% of GDP in 1997, and about seven million people, 60% of the population at the time, experienced direct or indirect impacts. The figures vary depending on the source and methodology.
There is a nuance about the type of damage: in Ecuador, the productive sector absorbed 52.8% of the losses of 1997-98, and for every dollar of direct material damage there were about 2.66 dollars of indirect losses due to lost income.
• November 12: New monthly CPC/NOAA discussion, with updated probabilities.
• Communiqués from ENFEN and Senamhi (Peru), which are issued biweekly.
• Warnings from INAMHI and CN-ERFEN (Ecuador) on rainfall and sea level.
• Seasonal forecast from the DMC (Chile) and quarterly forecast and alerts from the SMN (Argentina).
✅ Bear in mind
A seasonal forecast does not say which day or in which neighborhood it will rain. For specific decisions — irrigation, planting, drainage, navigation, travel — it is advisable to consult the official short-term alerts of your country and review the contingency plans of homes, businesses and establishments before the months of greatest risk begin.
It is a journalistic name for events of very strong intensity. The Chilean Meteorological Directorate clarifies that it is not an official scientific category; NOAA speaks of strong or very strong events according to the RONI quarterly index.
It cannot yet be confirmed. NASA observes an ocean pattern very similar to that of October 1997 and its scientist believes that it could end up being higher, and NOAA gives 83% chance of a historic event in October-December. But these are forecasts: the final intensity will be known when the quarterly averages are consolidated.
NOAA expects it to persist through March-May 2027, with favorable neutral conditions toward April-July. The WMO sees near 100% probability of continuity through February 2027, and the NFENS and DMC project effects through the austral fall of 2027.
The risk increases where forecasts call for above-normal rainfall: the northern coast of Peru, the coast of Ecuador, central and south-central Chile, and the Argentine coast. But quarterly forecasts are averages and do not indicate where or when a specific storm will hit.
A typical El Niño adds 0.1 to 0.2 °C to the global average, with a peak about three months after its peak. That is why the WMO considers 2027 likely to be a new record year.
Transparency note: this article was prepared with official sources and specialized press consulted on October 24, 2026. Forecasts are updated permanently and figures may vary.
All sources were consulted on October 24, 2026.
1. NOAA / Climate Prediction Center — ENSO Diagnostic Discussion (8 oct 2026)
2. NASA Earth Observatory — El Niño Then and Now (23 oct 2026)
3. Infobae — El Niño of 2026 under NASA's magnifying glass (Oct 23, 2026)
4. Europa Press / Article 14 — WMO forecasts anomaly of up to +3.7°C (8 Oct 2026)
5. El Economista — September 2026 was the second warmest; Copernicus data
6. Meteored — WMO warns of more heat records coming
7. Mercado Magazine — Berkeley Earth and the chance of a record in 2026
8. Pantel — Super El Niño: What Makes It Stronger Than Ever in 2026?
9. El Búho — ENFEN: The Extraordinary Coastal El Niño until May 2027 (15 Sep 2026)
10. Management — ENFEN maintains the state of alert until mid-autumn 2027
11. Caretas — Peruvian coast with temperatures up to 5 °C above normal
12. RPP — Temperature record in Piura (Senamhi)
13. América TV — Senamhi: peak of the Global Niño at the end of the year
14. Scoops — Sea Level Rises 40 cm in Ecuador (CN-ERFEN)
15. El Comercio (Ecuador) — INAMHI forecasts increased rainfall due to El Niño (Sept. 14, 2026)
16. El Comercio (Ecuador) — INAMHI rules out that the August rains are due to El Niño
17. Meteored Chile — DMC anticipates a rainier end of 2026 in central Chile
18. CNN Chile — DMC predicts that the peak of El Niño will be between October and November
19. The Clinic — Winter Arrives with the Influence of El Niño (Sarricolea)
20. BioBioChile — DMC clarifies that "super Niño" is not an official category
21. SMN Argentina — Quarterly Climate Forecast Oct-Dec 2026 (PDF)
22. Profile — The SMN anticipated above-normal rainfall for Oct-Dec 2026
23. Andina — Impact of El Niño in Peru: 1982-83, 1997-98 and 2017
24. EY Peru — El Niño phenomenon: can its impact be reduced? (CAF figures)
25. Scoops — El Niño 1997-98 in Ecuador (ECLAC)
26. Scoops — Losses for the Ecuadorian productive sector
🔗 Where to follow it in real time (official bodies)
• NOAA / CPC: https://www.cpc.ncep.noaa.gov/products/analysis_monitoring/enso_advisory/ensodisc.shtml
• ENFEN (Peru): https://enfen.imarpe.gob.pe
• Senamhi (Peru): https://www.senamhi.gob.pe
• SMN (Argentina) — El Niño: https://www.smn.gob.ar/enos
• SMN (Argentina) — Alerts: https://www.smn.gob.ar/alertas
🛠️ SEO Technical Annex and Publication (Do Not Publish)
⚙️ Instructions
This section is for the blog editor only. Replace the UPPERCASE texts (domain, author, blog name, logo) and fill in the actual height of each image before publishing.
1. SEO Sheet
|
Field
|
Recommended value
|
|
Primary Keyword
|
El Niño 2026
|
|
Secondaries/Entities
|
El Niño super; El Niño 1997 comparison; El Niño Costero ENFEN; El Niño El Niño forecast; El Niño rains Argentina; El Niño Peru Ecuador Chile Argentina; RONI; NOAA CPC; WMO
|
|
Long tail (questions)
|
is El Niño 2026 stronger than the one in 1997?; when does El Niño 2026 end?; how does El Niño affect Argentina in summer?; what is a super El Niño?
|
|
Search intent
|
Informative / current news (suitable for Top Stories and Discover)
|
|
Title tag (50 car.)
|
Super El Niño 2026 vs 1997: impacts in South America
|
|
Meta description (140 car.)
|
NASA compares El Niño in 2026 with that of 1997 and NOAA predicts a historic event. What Peru, Ecuador, Chile and Argentina expect until 2027.
|
|
Slug
|
/super-el-niño-2026-vs-1997-peru-ecuador-chile-argentina/
|
|
Structure
|
A single H1 with the keyword; H2 per thematic block; H3 per country and per FAQ; index with anchor links
|
|
Featured image
|
Minimum 1200px wide (NASA is 1280px), 16:9 format or similar, with descriptive alt
|
|
Schematics
|
NewsArticle + FAQPage (JSON-LD más abajo)
|
|
Freshness (E-E-A-T)
|
Update the article and dateModified after November 12 (CPC) and each statement from ENFEN, the SMN and the DMC. Keep primary sources cited and author with profile.
|
|
Internal Linking
|
Link to and from your own articles on climate, agriculture, fishing, economy and rainfall preparedness guides; use descriptive anchors, not "click here".
|
|
Performance (Core Web Vitals)
|
WebP/AVIF images with defined width and height, loading=lazy except for the cover, font with display=swap and preconnect.
|
2. Labels for the <head>
<!-- Font -->
<link rel="preconnect" href="https://fonts.googleapis.com">
<link rel="preconnect" href="https://fonts.gstatic.com" crossorigin>
<link href="https://fonts.googleapis.com/css2?family=Montserrat:wght@400;600;700;800&display=swap" rel="stylesheet">
<!-- Basic SEO -->
<title>Super El Niño 2026 vs 1997: impacts in South America</title>
<meta name="description" content="NASA compares El Niño in 2026 with that of 1997 and NOAA predicts a historic event. What do Peru, Ecuador, Chile and Argentina expect until 2027." >
<meta name="robots" content="index, follow, max-image-preview:large, max-snippet:-1">
<link rel="canonical" href="https://midire.ar/super-el-nino-2026-vs-1997-peru-ecuador-chile-argentina/">
<link rel="alternate" hreflang="es" href="https://Midire.ar/super-el-nino-2026-vs-1997-peru-ecuador-chile-argentina/">
<!-- Open Graph / Twitter -->
<meta property="og:type" content="article">
<meta property="og:title" content="Super El Niño 2026 vs 1997: impacts in South America">
<meta property="og:description" content="NASA compares El Niño in 2026 with that of 1997 and NOAA predicts a historic event. What do Peru, Ecuador, Chile and Argentina expect until 2027." >
<meta property="og:url" content="https://Midire.ar/super-el-nino-2026-vs-1997-peru-ecuador-chile-argentina/">
<meta property="og:image" content="https://assets.science.nasa.gov/content/dam/science/esd/eo/images/iotd/2026/el-ni%C3%B1o-then-and-now/elninocomp_sen6_20261012_th.jpg/jcr:content/renditions/cq5dam.web.1280.1280.jpeg">
<meta property="og:locale" content="es_AR">
<meta property="article:published_time" content="2026-10-24T20:40:00-03:00">
<meta name="twitter:card" content="summary_large_image">
3. Structured Data (JSON-LD)
<script type="application/ld+json">
{
"@context": "https://schema.org",
"@type": "NewsArticle",
"mainEntityOfPage": {
"@type": "WebPage",
"@id": "https://Midire.ar/super-el-nino-2026-vs-1997-peru-ecuador-chile-argentina/"
},
"headline": "Super El Niño 2026: the Pacific warms up like in 1997 and South America enters a countdown",
"description": "NASA compares El Niño in 2026 with that of 1997 and NOAA predicts a historic event. What do Peru, Ecuador, Chile and Argentina expect until 2027.",
"image": [
"https://assets.science.nasa.gov/content/dam/science/esd/eo/images/iotd/2026/el-ni%C3%B1o-then-and-now/elninocomp_sen6_20261012_th.jpg/jcr:content/renditions/cq5dam.web.1280.1280.jpeg"
],
"datePublished": "2026-10-24T20:40:00-03:00",
"dateModified": "2026-10-24T20:40:00-03:00",
"inLanguage": "es",
"articleSection": "Clima",
"keywords": "El Niño 2026, super El Niño, El Niño 1997, ENFEN, SMN, Peru, Ecuador, Chile, Argentina",
"author": {
"@type": "Person",
"name": "Cronywell",
"url": "https://Midire.ar/autor/"
},
"publisher": {
"@type": "Organization",
"name": "Pi-MiDire",
"logo": {
"@type": "ImageObject",
"url": "https://Midire.ar/logo.png"
}
}
}
</script>
<script type="application/ld+json">
{
"@context": "https://schema.org",
"@type": "FAQPage",
"mainEntity": [
{
"@type": "Question",
"name": "What is a "super El Niño"?"
"acceptedAnswer": {
"@type": "Answer",
"text": "It is a journalistic name for events of very strong intensity. The Chilean Meteorological Directorate clarifies that it is not an official scientific category; NOAA speaks of strong or very strong events according to the quarterly RONI index."
}
},
{
"@type": "Question",
"name": "Is the El Niño of 2026 stronger than the one of 1997?"
"acceptedAnswer": {
"@type": "Answer",
"text": "It can't be said yet. NASA observes an ocean pattern very similar to that of October 1997 and its scientist believes that it could end up being higher, and NOAA gives an 83% chance of a historic event in October-December. But they are forecasts: the final intensity will be known when the quarterly averages are consolidated."
}
},
{
"@type": "Question",
"name": "How long will El Niño last?"
"acceptedAnswer": {
"@type": "Answer",
"text": "NOAA expects it to persist through March-May 2027, with favorable neutral conditions towards April-July. WMO sees near 100% probability of continuity through February 2027, and NFENS and DMC project effects through austral autumn 2027."
}
},
{
"@type": "Question",
"name": "Will there be floods in Peru, Ecuador, Chile and Argentina?",
"acceptedAnswer": {
"@type": "Answer",
"text": "The risk increases where forecasts mark above-normal rainfall: the northern coast of Peru, the coast of Ecuador, central and south-central Chile, and the Argentine coast. But quarterly forecasts are averages and do not indicate where or when a specific storm will strike."
}
},
{
"@type": "Question",
"name": "How does El Niño influence global temperature?",
"acceptedAnswer": {
"@type": "Answer",
"text": "A typical El Niño adds 0.1 to 0.2 °C to the global average, peaking about three months after its peak. That is why the WMO considers it likely that 2027 will be a new record year."
}
}
]
}
</script>
4. CSS responsive with Montserrat typography
body{font-family:'Montserrat',system-ui,-apple-system,'Segoe UI',Arial,sans-serif; line-height:1.7; margin:0}
article{max-width:720px; margin:0 auto; padding:0 16px}
article img{max-width:100%; height:auto; display:block}
article table{display:block; overflow-x:auto; border-collapse:collapse; width:100%}
h1{font-size:clamp(1.6rem,4.5vw,2.4rem); line-height:1.2}
@media (max-width:600px){article{padding:0 14px}}
5. Images with absolute link (HTML ready to paste)
<figure>
<img src="https://assets.science.nasa.gov/content/dam/science/esd/eo/images/iotd/2026/el-ni%C3%B1o-then-and-now/elninocomp_sen6_20261012_th.jpg/jcr:content/renditions/cq5dam.web.1280.1280.jpeg" alt="Pacific satellite map with positive sea level anomalies to the coast of South America, October 2026" loading="lazy" decoding="async" width="1280" height="ADJUST">
<figcaption>Pacific sea level, October 12, 2026. Credit: NASA Earth Observatory/Lauren Dauphin.</figcaption>
</figure>
<figure>
<img src="https://assets.science.nasa.gov/content/dam/science/esd/eo/images/iotd/2026/el-ni%C3%B1o-then-and-now/elninocomp_sen6_19971013_lrg.jpg" alt="Pacific Sea Level Map, October 13, 1997" loading="lazy" decoding="async" width="1280" height="ADJUST">
<figcaption>Sea level, October 13, 1997. Credit: NASA Earth Observatory/Lauren Dauphin.</figcaption>
</figure>
<figure>
<img src="https://assets.science.nasa.gov/content/dam/science/esd/eo/images/iotd/2026/el-ni%C3%B1o-then-and-now/elninocomp_sen6_20261012_lrg.jpg" alt="Pacific Sea Level Map, October 12, 2026" loading="lazy" decoding="async" width="1280" height="ADJUST">
<figcaption>Sea Level, October 12, 2026. Credit: NASA Earth Observatory/Lauren Dauphin.</figcaption>
</figure>
<figure>
<img src="https://assets.science.nasa.gov/content/dam/science/esd/eo/images/iotd/2026/el-ni%C3%B1o-then-and-now/elninotriptych_sen6_20261012.jpg" alt="Three stacked maps comparing sea level in October 1997, 2015 and 2026" loading="lazy" decoding="async" width="1280" height="ADJUST">
<figcaption>Octubre de 1997, 2015 y 2026. Crédito: NASA Earth Observatory / Lauren Dauphin.</figcaption>
</figure>
⚠️ Image Verification
The URLs of images correspond to those that NASA publishes in its note "El Niño Then and Now". I could not open them from my work environment, so it is advisable to verify that they load before publishing. To avoid broken links or consumption of third-party bandwidth, the ideal is to download them and host them on your own server. Also review NASA's media usage guidelines and keep the credit.
Typeface: Montserrat (Google Fonts) — https://fonts.google.com/specimen/Montserrat. If it's not installed on your computer, Word will display a replacement font; install it to see the original layout.
Close
 Super El Niño 2026: the Pacific warms up like in 1997 and South America counts down - by